 04/29/2026
  Steve Bearden
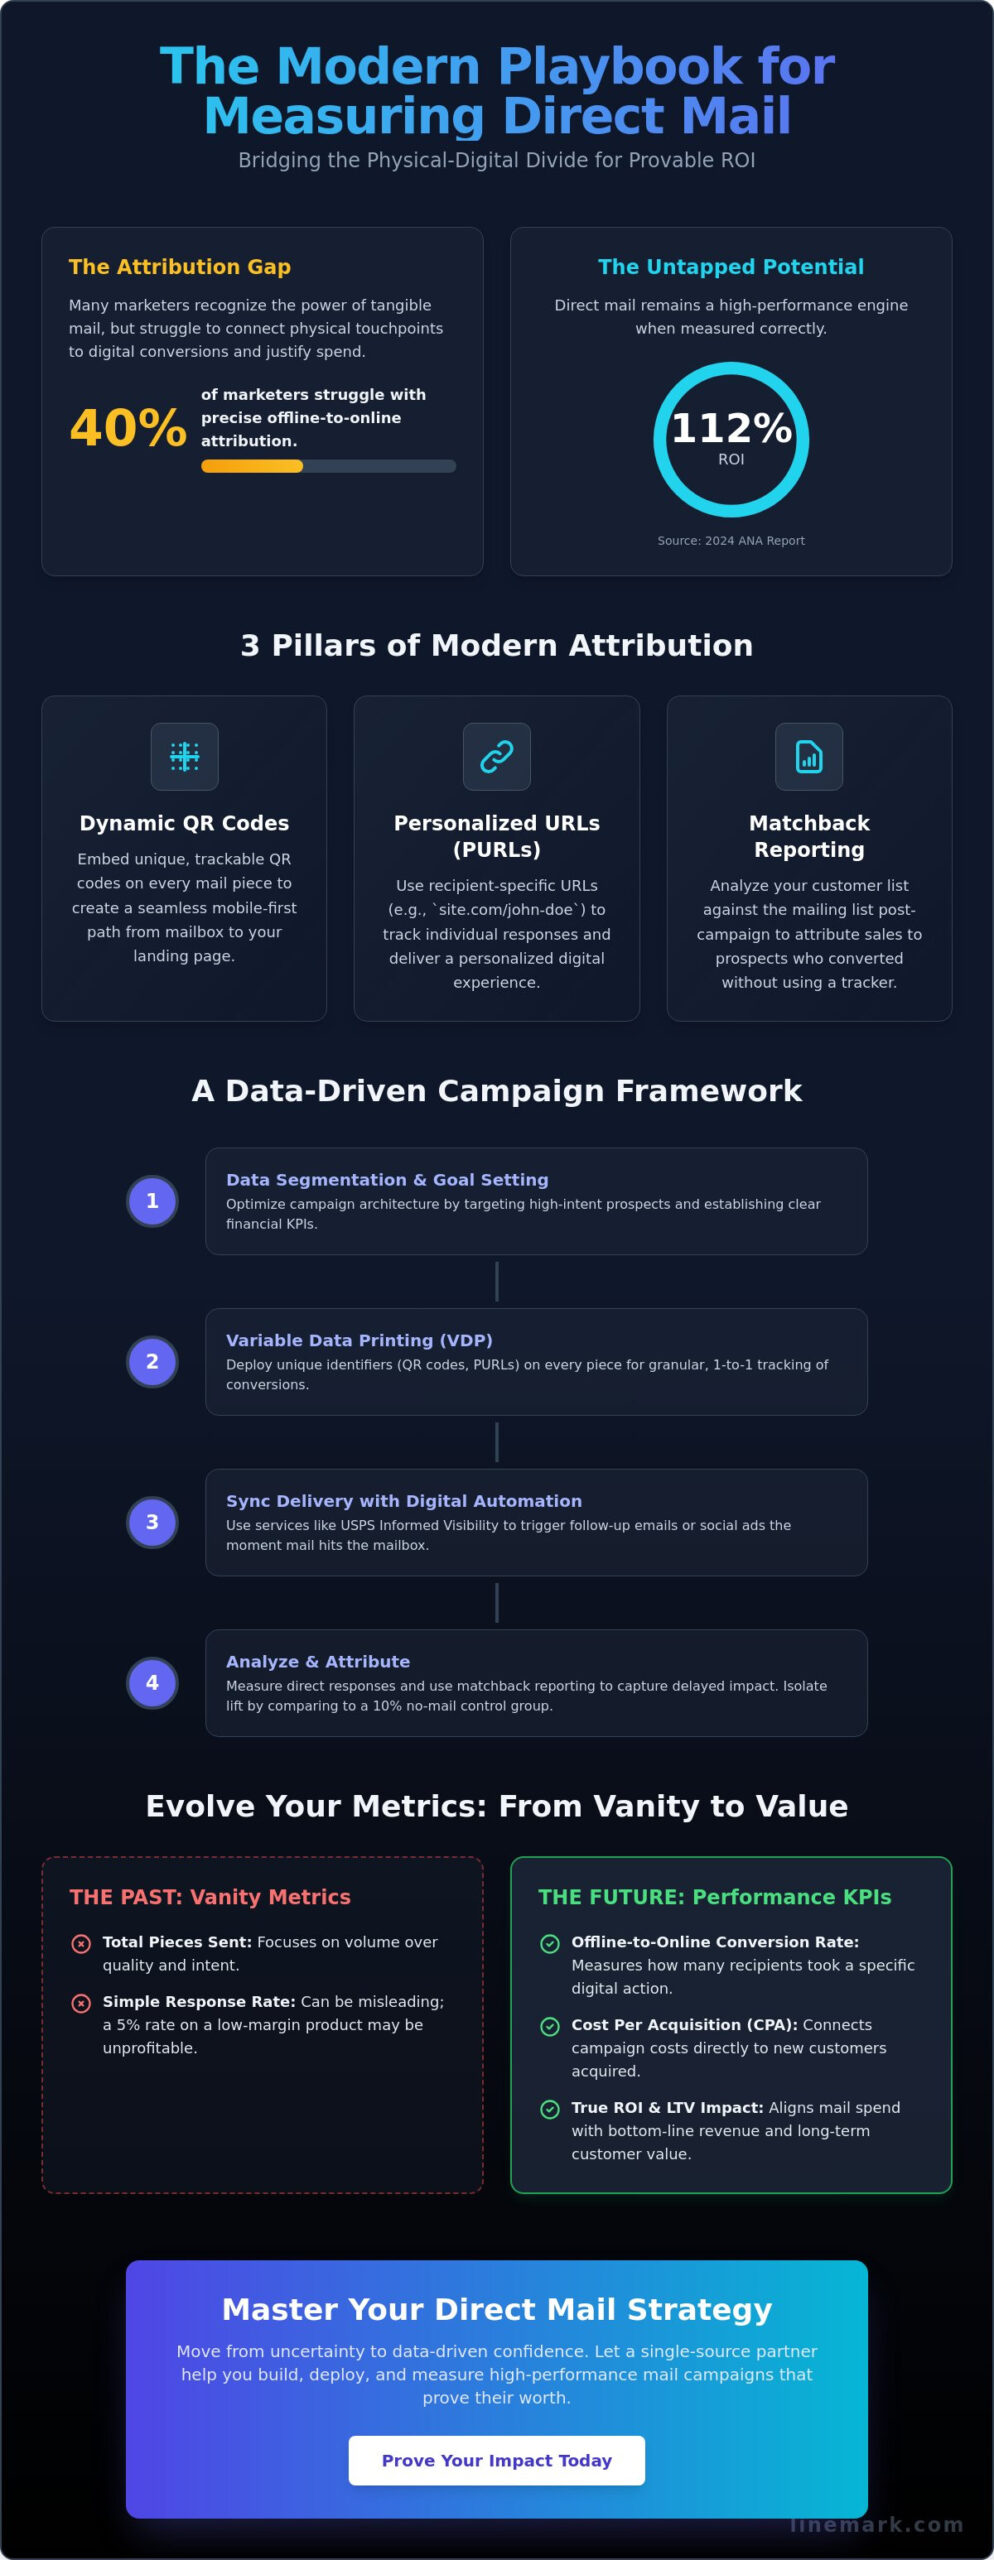
A 2024 report from the Association of National Advertisers shows that direct mail generates a 112% return on investment, yet 40% of marketers still struggle to connect these physical touchpoints to digital conversions. If you’re feeling the pressure to justify your spend against real-time digital metrics, you aren’t alone. You recognize the power of a tangible mailer, but measuring direct mail effectiveness often feels like solving a puzzle with missing pieces. It’s frustrating to see high engagement without the precise attribution data your leadership demands.
We’re here to provide the clarity you need. This guide will help you master the science of tracking offline-to-online conversions so you can prove the bottom-line impact of every campaign. As your single-source partner, we’ve developed a scalable process that turns traditional mail into a high-performance engine. We will outline a framework for national campaigns that utilizes QR codes, PURLs, and matchback reporting to drive higher response rates. You’ll gain a data-driven strategy that ensures your budget is never wasted on non-responsive lists again.
Key Takeaways
- Shift from vanity metrics to performance-driven results by bridging the physical-digital divide with advanced attribution tools.
- Master the science of measuring direct mail effectiveness by aligning financial KPIs with production costs to prove bottom-line impact.
- Optimize campaign architecture through rigorous data segmentation and clear goal-setting to ensure your messaging reaches high-intent prospects.
- Eliminate operational data silos and improve delivery precision by leveraging a single-source partner for integrated printing and fulfillment.
- Utilize variable data printing to deploy unique identifiers on every piece, enabling granular tracking of every offline-to-online conversion.
Why Measuring Direct Mail Effectiveness is Critical in 2026
In 2026, the definition of marketing success has evolved far beyond the volume of mailers dispatched. It’s now centered on the precision of linking a physical touchpoint to a specific revenue outcome. For decades, Direct mail marketing was often judged by vanity metrics like total pieces sent. Today, sophisticated brands view every mailer as a data-generating asset. True effectiveness is defined by the ability to trace a physical postcard directly to a digital conversion or a measurable increase in lifetime value (LTV). This transformation relies on the seamless integration of CRM data with high-speed print production, turning static mail into a dynamic component of the modern marketing stack.
To better understand the impact of physical mail in a digital world, watch this helpful video:
The 2026 landscape demands that print production no longer operates in a vacuum. As a single-source partner, we emphasize that direct mail is most potent when it functions as a physical extension of your digital ecosystem. This requires a tighter feedback loop between your CRM and the pressroom. When a customer abandons a cart or hits a specific loyalty milestone, an automated trigger should initiate a high-quality, personalized mail piece within 24 hours. This level of synchronization ensures that measuring direct mail effectiveness becomes a standard part of your attribution modeling rather than a separate, manual calculation.
The Challenge of Offline-to-Online Attribution
Physical mail often exists in a “dark social” state within the household. A 2024 industry study found that 72% of households keep mail for at least two days, often on a kitchen counter or desk. This creates a delayed impact that standard digital analytics frequently miss. To solve this, your strategy must include unique digital entry points for every recipient. Utilizing personalized URLs (PURLs) or unique QR codes allows your team to capture the exact moment a physical touchpoint triggers a digital action. This creates a clear path from the mailbox to the checkout page.
Moving Beyond Simple Response Rates
A high response rate doesn’t always guarantee a profitable campaign. In fact, a 5% response rate on a low-margin product may underperform a 1% response rate for a high-value service. We look for the LineMark difference by correlating mail drops with baseline traffic spikes in specific geographic regions. This analysis reveals long-tail conversions that happen weeks after the initial drop. Monitoring these 14-day and 30-day windows ensures you aren’t ignoring the persistent influence of high-quality print. By focusing on performance metrics over vanity counts, you secure a more accurate ROI for every dollar spent on postage and production.
Modern Attribution Tools: Bridging the Physical-Digital Divide
Measuring direct mail effectiveness requires a sophisticated technical stack that mirrors modern digital analytics. You’ll need a centralized CRM, a marketing automation platform like HubSpot or Salesforce, and a printing partner capable of high-speed data integration. By syncing mail delivery dates with your digital dashboard, you can observe real-time spikes in web traffic or search volume. Marketers often reserve a 10% control group, a segment of the audience that receives no mail, to isolate the exact impact of a mailing. This method allows for calculating direct mail ROI with precision by comparing the behavior of those who received the mail against the baseline group.
Integrating mail tracking data directly into your automation platform transforms a physical postcard into a trackable digital asset. When the USPS Informed Visibility service confirms a piece has reached a mailbox, your CRM can trigger a follow-up email or a social media ad. This multi-channel synchronization ensures your message stays top-of-mind. It’s a level of operational excellence that turns a traditional medium into a high-tech solution for growth.
Leveraging Dynamic QR Codes and PURLs
Dynamic QR codes are the most efficient bridge between the physical and digital worlds. To maximize scans, place the code in a high-contrast area with a clear instruction like “Scan for 20% Off.” Data from 2025 indicates that QR codes featuring a brand logo in the center see a 12% increase in engagement over standard black-and-white versions. For high-value targets, Personal URLs (PURLs) provide a customized landing page experience that greets the user by name. This level of personalization drives higher scan-to-conversion rates. By tracking these individual interactions, you can identify which creative assets, such as a specific lifestyle image or a bold headline, resonate most with your audience segments.
Variable Data Printing (VDP) as a Measurement Engine
Variable Data Printing (VDP) is the core technology that enables digital-level tracking for physical mail. This process allows you to swap offers, headlines, or images for different audience segments within a single print run. You might send a “Welcome Back” offer to dormant customers while simultaneously sending a “New Member” discount to prospects. Using unique offer codes at the individual level prevents coupon leakage and ensures attribution is 100% accurate. Each code is tied to a specific recipient in your database; when it’s redeemed at checkout, the loop closes automatically. As your single-source partner, we provide the technical infrastructure to manage these complex datasets, ensuring your campaign is both scalable and meticulously tracked.
Essential KPIs: Calculating the True ROI of Your Mailings
To master the art of measuring direct mail effectiveness, you must look beyond simple delivery counts. Operational metrics like mail piece tracking provide a baseline for logistics; however, financial KPIs determine your campaign’s actual scalability. Successful marketers in 2026 integrate every cost component, including postage, list acquisition, and production, into their net profit models. By viewing these as a single investment rather than fragmented expenses, you gain a clear picture of your return. Our role as a single-source partner is to provide the transparency needed to bridge the gap between production data and revenue results.
Speed to conversion is a vital metric for optimizing your mailing schedule. While digital ads might see instant clicks, the physical nature of mail creates a unique attribution window. Data from industry benchmarks indicates that 79% of households act on direct mail immediately, yet the piece often remains in the home for an average of 17 days. This physical lifespan requires a longer tracking period to capture delayed conversions that shorter digital windows often miss. Adjusting your attribution window to 30 or 45 days ensures you aren’t undercounting the value of your physical touchpoints.
Response Rate vs. Conversion Rate
The response rate measures the initial engagement, such as a QR code scan or a visit to a personalized URL. In contrast, the conversion rate tracks the completed transaction. High response rates are often vanity metrics if they don’t lead to sales. A targeted campaign might yield a modest 2% response rate but a 50% conversion rate among those respondents. This indicates a high-quality audience and a message that resonates with intent. Precision in your mailing list allows for these high-yield outcomes, shifting the focus from volume to value.
Customer Acquisition Cost (CAC) and Lifetime Value (LTV)
Calculating the CAC for direct mail involves dividing the total campaign cost by the number of new customers acquired. While the initial CAC might be higher than a social media lead, the LTV of a mail-acquired customer often exceeds digital counterparts by 20% or more. This “tangibility effect” builds a deeper brand connection that digital channels can’t easily replicate. We emphasize multi-touch attribution to ensure the mail piece receives proper credit within the larger marketing ecosystem. When measuring direct mail effectiveness, recognizing the long-term loyalty of these customers is essential for justifying your marketing spend and driving sustainable growth.
Implementation Guide: Setting Up a Measurable Campaign
Operational excellence in direct mail begins long before the first piece hits the press. To master measuring direct mail effectiveness, you must approach your campaign with the precision of a logistics expert. This systematic process ensures that every dollar spent is accounted for and every response is captured accurately. At LineMark, we view this as the foundation of a strategic communications partnership.
- Step 1: Define Singular Goals. Don’t dilute your data by chasing multiple objectives. Focus on one primary KPI, such as lead generation or direct sales. Industry benchmarks from 2024 indicate that campaigns with a singular focus see a 22% lift in attribution accuracy compared to multi-goal efforts.
- Step 2: Clean and Segment Data. Use CASS and NCOA updates to eliminate undeliverable addresses. High-intent prospects are found through rigorous data hygiene, not just raw volume.
- Step 3: Deploy Tracking Mechanisms. Integrate QR codes, Personalized URLs (PURLs), or unique call-tracking numbers. These act as digital breadcrumbs that link physical touchpoints to digital conversions.
- Step 4: Establish a Control Group. Maintain a “hold-out” group of 10% of your list that receives no mail. This allows you to measure the true incremental lift and isolate the impact of the mailer from other marketing channels.
- Step 5: Analyze and Iterate. Use real-time dashboards to monitor scans and calls. Conduct a full post-mortem analysis 30 days after the final drop to capture late responders.
Designing for Tracking and Engagement
Visibility is the primary driver of measurement accuracy. Your CTA must be the most prominent element on the page, positioned where the eye naturally rests. Reducing friction is equally vital; if a prospect has to type a long, complex URL, your tracking data will suffer. Ensure every QR code leads to a mobile-optimized landing page, as 95% of these interactions occur on smartphones. This seamless transition from physical to digital is a core component of the LineMark experience.
Executing A/B Split Tests for Continuous Optimization
Strategic innovation requires constant testing. We recommend the “Rule of One”: test only one variable at a time, such as the headline, the offer, or the format. This ensures your data remains clean and actionable. Utilize small-batch digital printing to run these tests on a segment of 5,000 pieces before committing to a national rollout. This agile approach minimizes financial risk while maximizing the measuring direct mail effectiveness for the final campaign.
Ready to elevate your strategy? Partner with a single-source partner that integrates high-tech printing with advanced attribution analytics.
Optimizing Performance with a Single-Source Fulfillment Partner
Measuring direct mail effectiveness requires more than just tracking codes; it demands operational precision. When data processing and physical production happen in separate facilities, critical information often gets lost in the handoff. This fragmentation leads to reporting delays that can skew attribution models by 12% or more. By utilizing a single-source partner, you ensure that every piece of mail is tracked from the moment it leaves the press to the second it hits a mailbox. Advanced kitting and fulfillment services provide the timing accuracy needed to prove ROI. If a kit arrives two days late, it misses the digital window, making it impossible to accurately attribute the lift in engagement. The LineMark experience centers on removing these data silos, providing a clear line of sight from the initial print file to the final delivery confirmation.
Integrating Data Processing with Physical Production
Accuracy begins with the list. USPS data indicates that approximately 10% of the population moves every year. Without National Change of Address (NCOA) updates performed immediately before printing, your measurement metrics will be inflated by undeliverable mail. Modern direct mail marketing in 2026 relies on this data-first approach to ensure every dollar is accounted for. Real-time delivery triggers allow marketers to synchronize digital follow-up emails within 24 hours of the physical piece arriving. This synchronization ensures that the physical and digital touchpoints work in tandem, providing a clearer picture of how each channel contributes to the final sale. It’s about creating a cohesive journey where the data informs the logistics, and the logistics validate the data.
Scalable Logistics: From Pilot to National Rollout
Transitioning from a localized pilot to a national campaign requires rigorous inventory management and a scalable infrastructure. Centralized fulfillment ensures that branding and messaging remain consistent across hundreds of locations, preventing the “brand drift” that often plagues decentralized campaigns. Leveraging MarCom On-Demand portals empowers local teams to execute measurable mailings while maintaining corporate oversight. This decentralized model allows branches to customize offers for their specific demographics while corporate retains access to the aggregate data needed for measuring direct mail effectiveness at scale.
- Real-time visibility: Monitor local campaign performance through a unified dashboard that tracks every branch.
- Automated replenishment: Maintain stock of high-performing marketing assets to prevent stockouts during peak seasons.
- Strategic distribution: Reduce shipping costs and transit times by utilizing a partner with high-volume logistics capabilities.
Mastering Your Data-Driven Mailing Strategy
The landscape of 2026 demands a shift from speculative marketing to precision-driven execution. Success now depends on bridging the physical-digital divide through modern attribution tools and a rigorous focus on actionable KPIs. By integrating advanced Variable Data Printing (VDP) capabilities, brands can deliver hyper-personalized content that resonates with individual recipients, turning static mail into a dynamic performance channel. This technical evolution ensures every piece of mail works harder to secure a measurable response.
Mastering the art of measuring direct mail effectiveness isn’t just about tracking deliveries; it’s about understanding the entire customer journey from the physical mailbox to the digital checkout. This level of insight requires a strategic ally who can manage the complexities of scale and data integrity. Linemark serves as your single-source partner, backed by a 90,000-square-foot high-tech production facility and over 30 years of data-driven mailing experience. We provide the industrial infrastructure and expertise needed to transform your mailing strategy into a scalable engine for growth. Discover the Linemark difference for your next direct mail campaign and take control of your ROI today. Your most successful campaign is just one data-driven mailing away.
Frequently Asked Questions
How do I track direct mail if I don’t use QR codes?
You track direct mail without QR codes by using personalized URLs, unique coupon codes, or dedicated tracking phone numbers. These methods allow for 1:1 attribution by linking a specific response to a unique recipient record in your database. Personalized URLs often generate a 15% higher engagement rate compared to generic landing pages because they offer a tailored user experience. This granular data ensures you’re measuring direct mail effectiveness with high precision.
What is a good response rate for a direct mail campaign in 2026?
A strong response rate for house lists in 2026 typically ranges between 5% and 9%; prospect lists generally see 1% to 3%. These figures reflect the 2024 ANA Response Rate Report benchmarks, which highlight the medium’s resilience against digital fatigue. High-performing campaigns often exceed these averages by utilizing hyper-personalized content and advanced data modeling to target high-intent segments. Our team helps you hit these targets through precision targeting and strategic execution.
How long should I wait to measure the results of a mailing?
You should wait 14 to 21 days after the mail drop to analyze initial response data, though full attribution requires a 60 day window. Direct mail has a longer shelf life than digital ads; 75% of responses typically occur within the first three weeks. Monitoring this tail-end activity is crucial for calculating a final ROI that accounts for delayed conversions from recipients who saved the mailer for future use. This patience ensures your data reflects the true impact of the campaign.
Can I integrate direct mail tracking with Google Analytics?
You can integrate direct mail tracking with Google Analytics by using UTM parameters on your personalized URLs or vanity domains. This setup allows you to view direct mail traffic alongside your digital channels in the Acquisition reports. By creating specific landing pages for your campaign, you’ll see bounce rates and conversion paths for every recipient who visits your site. This integration is a cornerstone of the LineMark difference, providing a holistic view of your omnichannel strategy.
What is the most accurate way to measure the ROI of a postcard campaign?
Matchback analysis is the most accurate method for measuring the ROI of a postcard campaign. This process involves comparing your sales data against your mailing list to identify every customer who made a purchase after receiving the mailer. Unlike digital clicks, matchbacks capture offline conversions and sales that don’t use a tracking code. This method provides a clear, data-backed proof of your campaign’s financial performance by identifying the exact revenue generated from the mail drop.
How does variable data printing improve campaign measurement?
Variable data printing improves measurement by allowing each mail piece to include unique identifiers like individual URLs or serialized barcodes. This technology transforms a mass mailing into thousands of individual experiments, letting you track which specific offers or images drive the most action. Using this technology is essential for measuring direct mail effectiveness at the individual level. It provides the granular insights needed to refine your targeting and increase your overall return on investment.
Is direct mail more expensive to track than digital ads?
Tracking direct mail isn’t more expensive than digital ads because the technology, such as unique codes and tracking phone numbers, is integrated into the production process. While digital platforms charge for every click or impression, direct mail tracking costs are often fixed or bundled into your fulfillment services. Partnering with a single-source partner ensures these tracking mechanisms are implemented efficiently. This keeps your overhead low while maintaining high data integrity across every campaign you launch.
What is a control group in direct mail and why do I need one?
A control group is a segment of your target audience that doesn’t receive the mailing, serving as a baseline for natural customer behavior. You need one to determine the true lift generated by your campaign versus sales that would’ve happened anyway. For example, if your control group has a 2% purchase rate and your mailed group has 5%, you’ve proven a 150% increase in conversion directly attributable to the mailer. This methodology provides the statistical confidence required for large-scale budget allocations.


